Get to know your fields better.
To yield mapping with just a few clicks.
Ertragskartierung
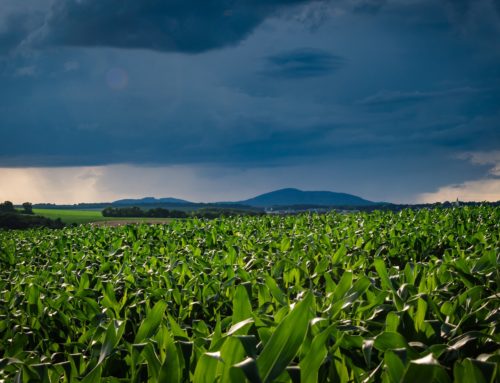
The grain harvest is in full swing. Yields have varied a great deal by region in the past. According to the German Farmers’ Association (Deutscher Bauernverband – DBV) winter barley achieved an average yield in Germany of 7.1 t/ha. The yield is thus slightly below the figures for 2013 to 2017.
An average of 7.35 t/ha of winter barley was harvested during this period.
An average of 6 t/ha is expected for winter wheat. The yield here is as much as 25% below average: an average of 8 t/ha of winter wheat was harvested in Germany from 2013 to 2017.

The low precipitation this year, among other things, has led to relatively low yields. However, the harvesting conditions have been ideal. The plants have withstood the weather well throughout the past few weeks and it has mostly not been necessary to let the wheat dry out.
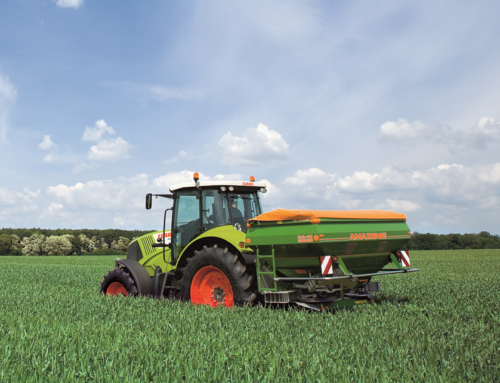
It has been possible to collect a lot of information during the grain harvest, which will also be significant to some extent for the coming harvest year. For example, it is possible to measure the yield and corn moisture using sensors. The yield readings are recorded every one to two seconds and are linked with precise, corrected GPS signals. This generates geographic coordinates that create a yield map when collated.
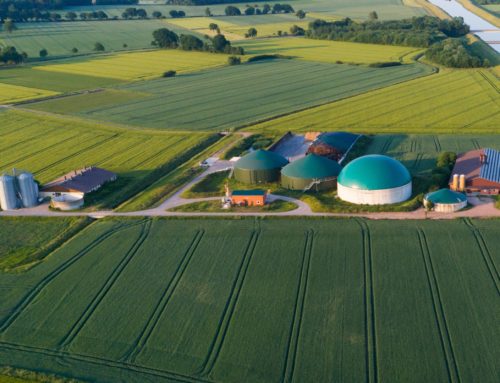
Yield mapping provides information about the properties and the potential of the field. But it is also used to monitor success and it shows the extent to which previous measures have been successful – such as fertilisation, for example. The data obtained using CLAAS TELEMATICS can be imported into the 365FarmNet account and then be visualised.